import pandas as pd
import numpy as npDecision Trees with Scikit-learn
In this module we will learn how to use the Decision Tree Classifier from the Scikit-learn library to classify diabetes data. We will use a dataset that contains various health measurements and whether or not the individual has diabetes.
df = pd.read_csv('diabetes.csv')df.head()| Pregnancies | Glucose | BloodPressure | SkinThickness | Insulin | BMI | DiabetesPedigreeFunction | Age | Outcome | |
|---|---|---|---|---|---|---|---|---|---|
| 0 | 6 | 148 | 72 | 35 | 0 | 33.6 | 0.627 | 50 | 1 |
| 1 | 1 | 85 | 66 | 29 | 0 | 26.6 | 0.351 | 31 | 0 |
| 2 | 8 | 183 | 64 | 0 | 0 | 23.3 | 0.672 | 32 | 1 |
| 3 | 1 | 89 | 66 | 23 | 94 | 28.1 | 0.167 | 21 | 0 |
| 4 | 0 | 137 | 40 | 35 | 168 | 43.1 | 2.288 | 33 | 1 |
Build a Decision Tree Classifier
from sklearn import tree
from sklearn.tree import DecisionTreeClassifier # Import Decision Tree Classifier
from sklearn.model_selection import train_test_split # Import train_test_split function
from sklearn import metrics #Import scikit-learn metrics module for accuracy calculation

features = ['Glucose', 'BloodPressure', 'Insulin', 'BMI', 'DiabetesPedigreeFunction', 'Age']

x = df[features]
y = df['Outcome']

# Split dataset into training set and test set
x_train, x_test, y_train, y_test = train_test_split(x, y, test_size=0.3, random_state=1) # 70% training and 30% test

# Create Decision Tree classifer object
clf = DecisionTreeClassifier(max_depth=3)

# Train Decision Tree Classifer
clf = clf.fit(x_train,y_train)

#Predict the response for test dataset
y_pred = clf.predict(x_test)

# Model Accuracy, how often is the classifier correct?
Accuracy = metrics.accuracy_score(y_test, y_pred)
print("Accuracy:", Accuracy)
Accuracy: 0.7575757575757576print(y_pred)[0 0 0 0 0 0 0 0 0 0 1 0 1 1 0 1 0 0 0 0 0 0 1 0 0 0 0 1 0 1 0 0 0 1 0 1 0
0 0 0 0 0 0 0 0 0 1 1 0 0 0 0 1 0 0 0 1 0 0 0 1 0 1 0 0 0 0 0 1 1 1 1 0 0
1 0 1 1 0 1 1 0 0 0 0 1 0 0 1 0 0 0 0 0 1 1 0 0 1 0 0 0 1 1 0 0 1 1 0 0 0
0 1 0 0 0 0 1 0 0 0 1 0 0 0 0 0 0 1 0 1 0 0 0 0 0 0 1 0 0 1 0 0 1 1 0 0 0
0 0 0 1 0 0 1 0 0 0 0 0 1 1 0 0 0 0 0 1 1 1 1 1 0 0 1 0 0 0 0 0 0 1 0 1 0
0 0 1 1 0 0 0 0 0 1 0 0 0 0 1 1 1 0 0 0 1 0 0 0 1 0 1 0 0 0 1 0 0 0 1 0 0
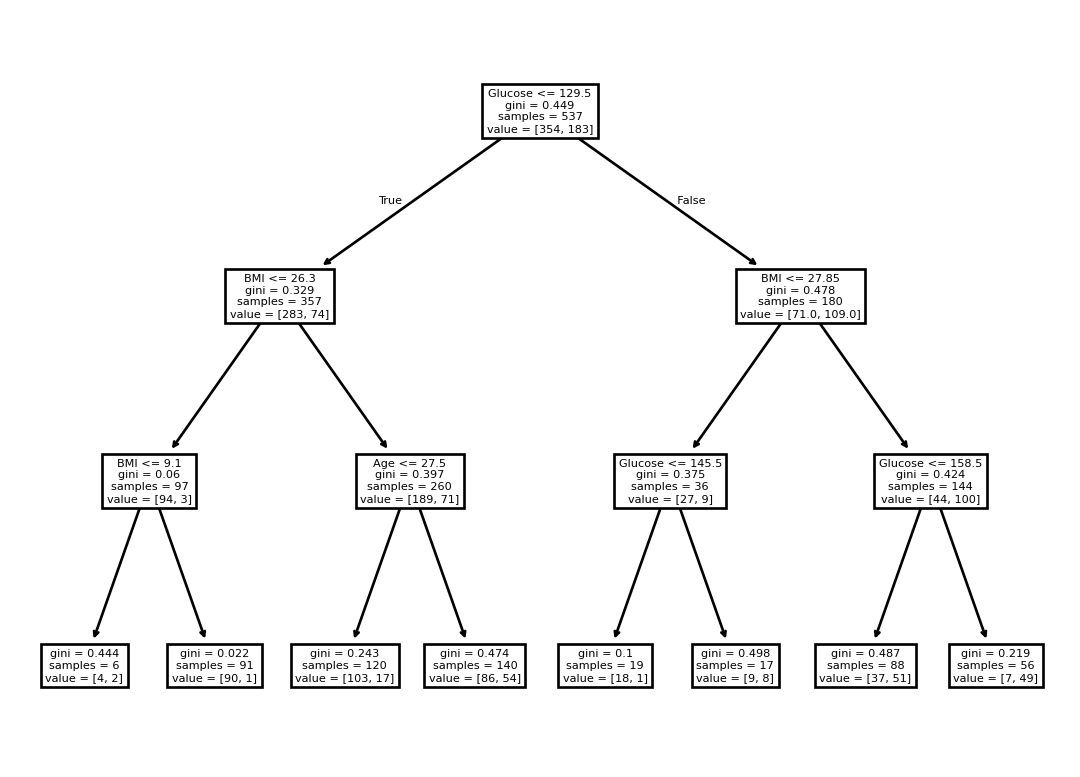
0 1 0 0 0 0 0 1 0]Visualizing the Decision Tree
tree.plot_tree(clf, feature_names=features)[Text(0.5, 0.875, 'Glucose <= 129.5\ngini = 0.449\nsamples = 537\nvalue = [354, 183]'),
Text(0.25, 0.625, 'BMI <= 26.3\ngini = 0.329\nsamples = 357\nvalue = [283, 74]'),
Text(0.375, 0.75, 'True '),
Text(0.125, 0.375, 'BMI <= 9.1\ngini = 0.06\nsamples = 97\nvalue = [94, 3]'),
Text(0.0625, 0.125, 'gini = 0.444\nsamples = 6\nvalue = [4, 2]'),
Text(0.1875, 0.125, 'gini = 0.022\nsamples = 91\nvalue = [90, 1]'),
Text(0.375, 0.375, 'Age <= 27.5\ngini = 0.397\nsamples = 260\nvalue = [189, 71]'),
Text(0.3125, 0.125, 'gini = 0.243\nsamples = 120\nvalue = [103, 17]'),
Text(0.4375, 0.125, 'gini = 0.474\nsamples = 140\nvalue = [86, 54]'),
Text(0.75, 0.625, 'BMI <= 27.85\ngini = 0.478\nsamples = 180\nvalue = [71.0, 109.0]'),
Text(0.625, 0.75, ' False'),
Text(0.625, 0.375, 'Glucose <= 145.5\ngini = 0.375\nsamples = 36\nvalue = [27, 9]'),
Text(0.5625, 0.125, 'gini = 0.1\nsamples = 19\nvalue = [18, 1]'),
Text(0.6875, 0.125, 'gini = 0.498\nsamples = 17\nvalue = [9, 8]'),
Text(0.875, 0.375, 'Glucose <= 158.5\ngini = 0.424\nsamples = 144\nvalue = [44, 100]'),
Text(0.8125, 0.125, 'gini = 0.487\nsamples = 88\nvalue = [37, 51]'),
Text(0.9375, 0.125, 'gini = 0.219\nsamples = 56\nvalue = [7, 49]')]